0 Global Macro: Low Volumes Equal Price Exaggeration


A truly macro approach is needed to derive some sense out of the market's action recently. Treasuries have shown great strength even in the face of higher equities; this somewhat compromises the move itself. However, a developing trend is that of 10 year yields (IEF) outpacing US equities (SPY). I use an equal weighted index of equities (RSP) in order to show the true nature of the trend. As seen below, in early August the indicator broke out to the upside. This is very bullish for stocks and hints that a downside barrier has at least been put in place by stimulus speculation. Another way of looking at this is by saying the height of the VIX (VXX) has been capped. Traders seem to believe that even if central banks don't act soon, in the case of a tail risk event, they will act.
A few good indicators to look at to measure market strength are the NYSE breadth indicators. The first one is that of Advance-Decline Volume vs. Total Volume. Volumes have been a huge issue in equities lately for various factors. The awaiting of both ECB and Fed action for late August/early September, and equities reaching 52 week high levels have put a lot of money on the sidelines. The indicator below looks to be pushing for an upward breakout, but a major catalyst must be put in place before the move is credible.
The next indicator is that of strictly Advance-Decline vs. Total ActiveIssues. This removes the volume aspect and shows what the markets are doing with exaggerated oscillations. With less money on the table, prices are free to move in an exaggerated fashion. This seems to be the case here, nonetheless, there seems to be an upside breakout. This looks to be another reiteration of equity strength.
A turn back into the debt market shows the strength of junk corporate bonds (JNK) vs. 10 year notes. The strengthening of the economic climate leads to junk outperformance. As seen below, junk has led in the previous rally and looks to be hitting a point of resistance. This makes sense considering the hold till September. A break higher would be another bullish sign for the markets.
A bear indicator exists when Utilities outperform the broader market. This is not the case currently, considering Utility stocks (XLU) look to be primed for a breakdown. They oscillated through the previous rally with uncertainty. Yet, at a point of consolidation, their breakdown could signal new found strength.
The last chart is that of gold (GLD) vs. corporate debt (CORP). Both are seen to show strength during periods of inflation, such as when central banks stimulate economies. They are somewhat seen as substitutes, but due to the debt properties of corporates, commodities offer a stronger inflationary case. When gold can outperform corporates, it usually signals a developing bullish run for gold and inflation hedged securities. The chart below shows a slight bottoming and even a break above the down trend line. Considering the conviction of belief that either the People's Bank of China, ECB, or Fed will act soon, inflationary expectations make sense. The indicators show growing belief in risk on strength, and to avoid another run up on the side lines, many may jump in on the next catalyst.

0 Equity Strength In The Face Of Traditional Weakness


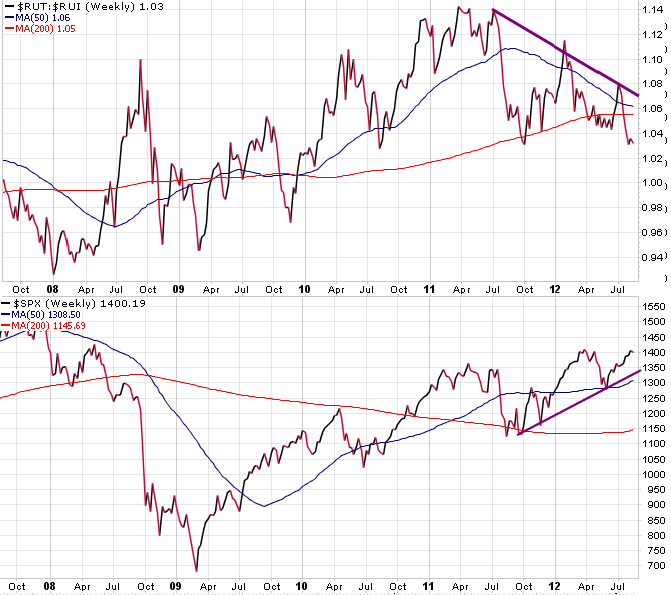
An interesting development crossing the headlines recently has been the lack of leadership in traditional bullish signals. The indicators in question are Russell 2000 (IWM) vs. Russell 1000 (IWB) and Transports (IYT) vs. Industrials (DIA). The divergence has just recently taken shape within the past year, and points to the fact that we are in a defensive rally. The lack of confidence seen in the markets seems to be a culmination of various factors. First is the volatility created by mishaps and market uncertainty. The presence of competing with and trying to outguess central bank actions has investors on edge, as well as market manipulating factors such as Knight Capital and other sentiment sapping developments. The next theme that has kept investors in defensive sectors is the search for yield. Many of the larger cap stocks offer less volatility, as well as yields unseen in the current low-risk bond markets. The defensive rally has many traders awaiting a cliff, and many others sitting on the sidelines letting gains pass them by.
Above is a five-year chart showing the relative strength of transports and industrials. The divergence is evident, and again, has led to many questioning the move's strength. The idea is that companies that ship should be performing as well, if not better, than the companies that produce. Similarly, the small cap Russell 2000 should outperform the Russell 1000 as a sign of risk tolerance. By putting one's money into riskier small caps, investors are signaling their trust in the economic environment. The chart below shows that too is not the case.
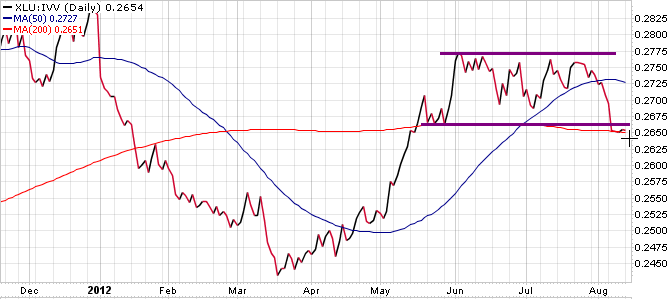
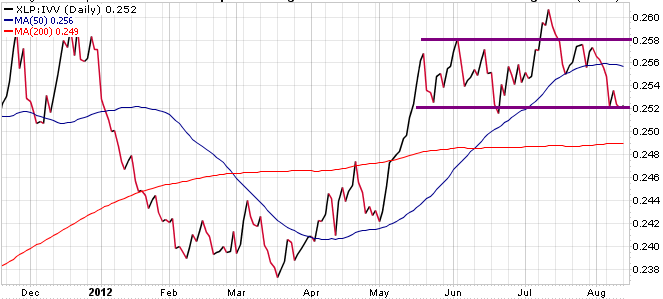
The chart shows again a negative divergence over the past year. This may cause some alarm, as it has already, but in comparison to other indicators, the equities show room for strength. The charts of both Utilities (XLU) and Consumer Staples (XLP) vs. the broader market (SPY) are shown below. As a risk off trade, these pairs should fall in strong markets. They have been oscillating within a range over the extended period of uncertainty within the financial markets, but they look to be breaking out lower in the near future. This may be a signal that ignites money coming off the sidelines, and brings belief to the rally.
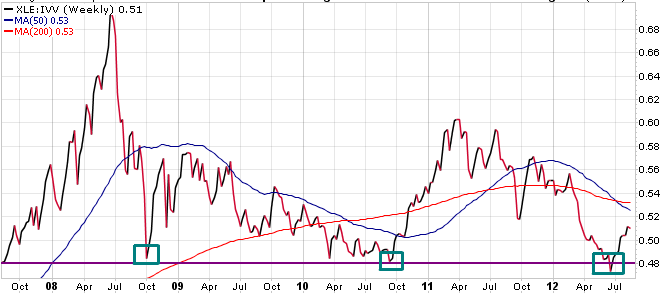
The final chart below is a somewhat alarming development within the move higher. It is true that energy stocks (XLE) should lead within a rally, but it is far and away leading this breakout. The rebound off of extremely weak levels and the diminished belief that the global economy would be thrown into a tailspin has aided XLE's move. Geopolitical risk is also somewhat weighted into the move higher. The only other times the pair had shown this much weakness was just before both QE1 and QE2 in 2008 and 2010 respectively. In all, it is not fair to say that an equity rise is leading to a gain in the XLE, so this somewhat compromises the strength. But with a shift from defensive into more cyclical sectors as a whole, sentiment should improve.

0 The World Awaits Stimulus


The current macro trade hinges on the move of central bank stimulation. Markets have become exuberant at the thought of accommodative monetary policy that should support risk assets. The current economic factors that have sustained this belief come in the area of weak inflation data, followed by weak inflation expectations. With Germany also showing weakness in recent economic releases, there could be more proof that a catalyst is in order.
click to enlarge images
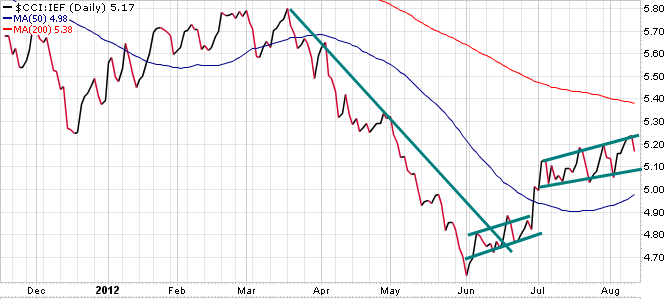
When monetary policy becomes accommodative, assets such as commodities should show signs of appreciation. The equal weight CRB index (CCI) tracks the very commodities that will benefit from the measures. The above chart shows commodities relative to risk off 10 years (IEF). The initial move higher followed the equities inverse head and shoulders breakout (SPY), and the current upward channel has been in line with the equities move as well.
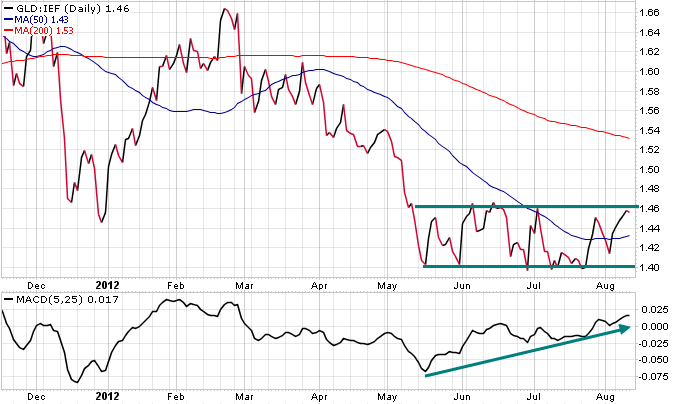
Along the same logic, gold (GLD) now trades as a risk asset and should also move with equities. After the selloff equities have been able to push higher, yet gold has been in a gridlock with the 10 yr. note throughout the duration. However, the divergence between the price action and the MACD oscillator signals a different story. The oscillator has been trending higher for 3 months and now sits in a bullish range. A breakout higher from the price action should be followed by MACD strength and be further support for an equities rally.
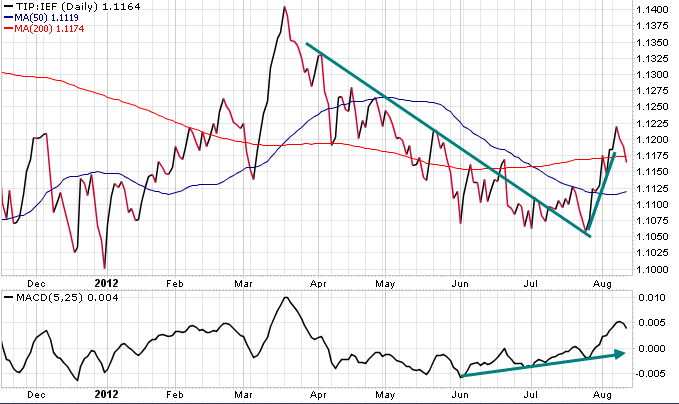
Inflation Indexed bonds (TIP) tend to catch demand in inflationary environments, and have shown strength in the face of current monetary stimulus. The chart above again confirms the equities move higher, and give signs of a move higher in commodities (DBC) across the board. The cross tends to move inverse to the dollar (UUP), so look for dollar weakness in the near future.
A turn to more equity centric measures brings us to the cross of Consumer Staples (XLP) and the broader market (IVV). Consumer Staples littered the headlines during the downturn recently, praised as solid dividend plays and promises of stability in a shaky market. However, with broader strength, a sideways pattern has emerged in the cross. Similarly, the MACD oscillator has shown weakness since mid June. With a downside breakout the SPY should find strength in the current trend.
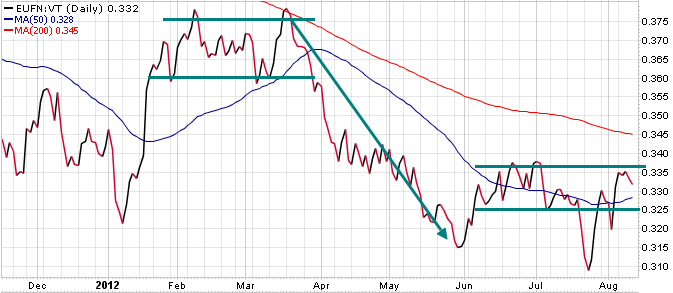
One of the final measures that will be looked at is the European financial sector (EUFN) compared to global equities (VT). The performance of this cross has spoken volumes in the risk vs. risk off trade recently. With the breakdown of financial institutions in Europe --- most notably in Greece, Ireland, and now Spain --- the political debate has surrounded around its resolve. In the current US rally, European financials have shown a period of consolidation. The path of least resistance has been up for now, yet a break in either direction for this cross will sway the direction of the broader markets over the intermediate term.
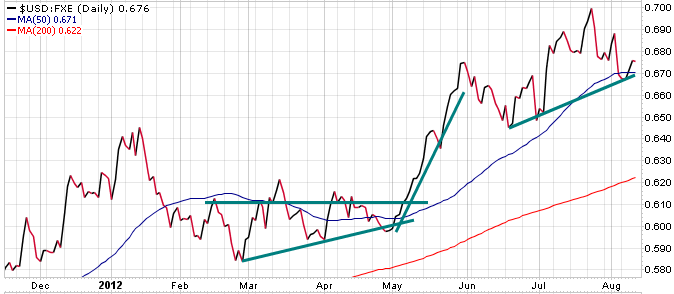
The culmination of this article resides in the trade of long Dollar and short Euro (FXE). The trade has been negatively correlated with equities and looks to be showing some weakness as of late. The break higher in May moved alongside a steep fall off for the SPY, but the overall trend looks to be rounding off at an intermediate top. The aggregation of price action and the preceding asset crosses above seem to point to near term weakness in the trade. The price is near a trend line and the MACD oscillator is in negative territory, which hints at a bearish undertone.
With the expectation of low inflation in China signaling further easing, and the BOE favoring easing to interest rate cuts, the environment looks to be shaping up for risk asset appreciation. Along the same, Germany is weakening which may open them up to more accommodative measures, and provide relief to a distressed region. Look to breakouts in the crosses above to signal the next step, but from what looks to be shaping, strength seems probable.

0 Macro Down


Macro Down is a site dedicated to the analysis of Global Financial Markets, and their interconnected nature.
 

MACRO DOWN Copyright © 2011 - |- Template created by O Pregador - |- Powered by Blogger Templates